Where can you find your measurement point data?
You can access your hydrological data through multiple sections of the platform:
-
From the dashboard: Click on the graph icon associated with your micro-station.

-
From the "Measurement Points" tab: This section includes your subscribed stations, demo stations, and third-party network stations.

Tip: You can uncheck demo stations to display only your subscribed stations.
What information is available on a micro-station's page?
General information
Each micro-station page provides the following key datas :
- Micro-station name: Can be customized using the 🖋️ icon.
- Measurement point type: (vorteX-io, Vigicrue, Third party instrumentation.).
- Monitored waterway.
- Date of first recorded measurements of the Micro-Station

Available graphs
The "Measurement Point" tab offers real-time visualization tools to track multiple hydrological indicators:
-
Water level:

-
Water rise speed (3-hour average):

-
Water surface velocity:

-
Hourly cumulative precipitation (OpenWeather data).

-
Temperature readings: Surface temperature (green); Outdoor air temperature (orange).

💧 Flow rate display
Want to visualize a flow rate graph?
To display a flow rate graph, simply provide a rating curve for the monitored section of the waterway. Once integrated into the platform, we will automatically calculate and display real-time flow rate datas.
Station status monitoring
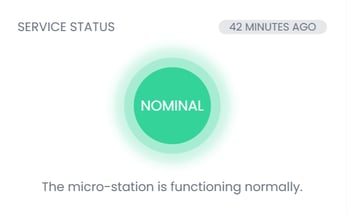
From our control center we continuously monitors the operational status of each Micro-Station. A service status indicator is displayed on each measurement point’s page.
🔗 Learn more about Micro-Station service statuses
Weather monitoring
Weather conditions near your Micro-Station including temperature, wind speed, humidity, and visibility are sourced from OpenWeather and updated in real time based on the closest available location.
Real-Time visual analysis
Our wide-angle cameras capture live images to provide a clear view of the waterway’s condition. You can also access surface velocity vectors, which help calculate the average surface speed of the water.
To explore information on the LiDAR measurement area or surface velocity vectors, click on the image and use the menu on the left side to select the available services.

⚠️ Why is surface velocity data unavailable at night?
Surface velocity measurements rely on the analysis of images collected by our micro-stations. Since darkness reduces the quality of the images, surface velocity data is unavailable at night.
Practical features
Selecting a Time Range
To select a time period, please click on the date window located at the top right of the water level graph.![]()

Once the time range is selected, simply refresh the page 🔄 for the corresponding data to appear on all the graphs.
💡 Tips: Zoom and Focus
To easily zoom on important events, simply click and drag to to highlight a specific area on the graph.

If you want to go back to the original view, just click on "Reset Zoom" at the top left corner of the water level graph.
Data Export
The vorteX-io platform provides various export options to help you analyze collected data more effectively.
Using the "Export" button at the top left of the screen, you can download hydrological data in CSV format, as well as images captured by the micro-station. These images include surface velocity vectors, offering valuable insights for further analysis.
Each graph has an "Export" button on the right side, making it easy for you to download specific data sets whenever you need them.
👤 Data export features are available only to account administrators and billing administrators.
Indicate corrected data:
This option helps you view measurements that have been recalculated by our algorithms to correct for any outliers or errors in the data.
When you enable "Indicate corrected data", the adjusted measurements will be displayed as orange dots, making it easier to identify the corrections.
💡To go further:
Altimetric reference systems on the vorteX-io platform