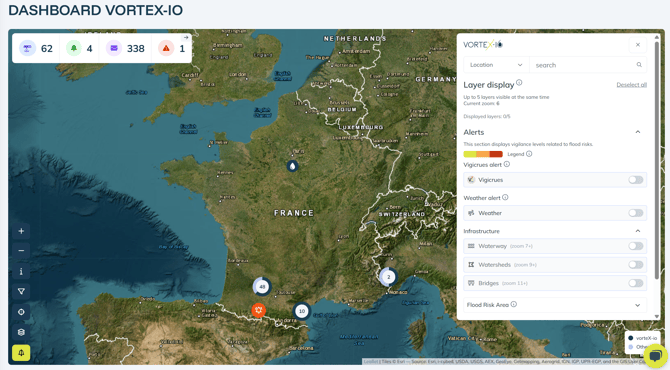
Key Indicators
At the top left of your dashboard header, you’ll find a summary view of critical indicators:
-
Number of available measurement points (to which you are subscribed)
-
Number of active notifications configured by your teams
-
Total notifications sent since activation
-
Measurement points in alert or that have crossed critical thresholds
Quick Access to Measurement Points
From the interactive map, you can directly access all measurement stations you’re subscribed to:
-
 vorteX-io icon: direct access to data from vorteX-io stations
 -
 Vigicrues icon: quick access to data from the Vigicrues flood monitoring service
Navigating the Dashboard
The main map-related features are accessible via the side menu, which can be opened by clicking the icon ![]() in the top right corner of the map.
in the top right corner of the map.
Advanced Search Features
The search bar allows you to explore data using several criteria:
-
Location name
-
Watercourse (river or stream)
-
Measurement points
💡 Tip:
When searching by watercourse, you can select multiple rivers or streams at once. Their entire path will be highlighted on the map for easy visualization.
Real-Time Alerts
Vigicrues Alerts
Flood alerts displayed on the map come from the official Vigicrues service:
🔗 www.vigicrues.gouv.fr
Alerted river sections are color-coded according to the alert level:
-
🟡 Yellow: moderate alert
-
🟠 Orange: high alert
-
🔴 Red: maximum alert
⚠️ Note:
Vigicrues alerts are only available in mainland France.
Weather Alerts
Weather alerts are provided by MeteoAlarm:
🔗 www.meteoalarm.org
Types of events monitored:
-
Flooding due to rain
-
Thunderstorms
-
River flooding
-
Coastal flooding
-
Intense rainfall
Infrastructure and Analysis Layers
This section lets you activate additional map layers to enrich your analysis:
-
Watercourses: visualize all rivers and streams within the selected area

-
Watersheds: display watershed boundaries to better understand the water flow dynamics across the territory

-
Bridges: activating both Bridges and Watercourses layers helps identify optimal locations for future sensor installations

⚠️ Note:
Some structures may not be suitable for sensor installation due to technical or environmental constraints.
Flood Risk Areas (TRI)
Flood risk zone data comes from the public platform:
🔗 data.gouv.fr
Activating this layer highlights the Flood Risk Areas (TRI), helping you identify the most vulnerable zones and better prepare for potential flood events.
⚠️Data Availability
TRI data is available exclusively for mainland France. For other territories, equivalent flood risk data can be integrated into the dashboard, provided it is supplied in a compatible format (e.g., Shapefile, GeoJSON, or other GIS-supported files).