The vorteX-io platform offers three ways to access measurement data:
- Locate a measurement point directly on the "Dashboard" map.
- Browse all your subscriptions in the "Measurement Points" section.
- Use the "Data Comparisons" tab for in-depth comparative analysis.
⚠️ Requirements
To create a comparison, you must first be subscribed to multiple measurement points.
To do this, go to the "Subscribe" tab and select the microstations you're interested in.
Once subscribed, you’ll find all your stations listed in the "Measurement Points" tab.
📘 Need help?
Check out our guide: How to subscribe to a new sensor
Creating a Comparison:
-
In the "Data Comparisons" tab, click on "New Data Comparison"
-
Add a label and confirm.
-
Click on the 👁️ icon, then use the "Add a sensor" dropdown menu to select the measurement points you want to include.
-
Click on "+" and choose a color for better identification.
-
Repeat this operation to add multiple stations.
-
Define the parameters:
-
Dates and update intervals,
-
Time offset (e.g., observing the impact of a flood at different times).
-
-
Click on "Save"
Case studies
Flood Wave Analysis:
Flood wave analysis on a watercourse involves studying the propagation and evolution of water levels during a flood event to anticipate its impacts and manage flood risks.
In January 2022, a significant flood was recorded along the Garonne River. The collected data enabled an analysis of how the flood wave propagated in terms of both amplitude and duration.

Flood Event on the Garonne – January 2022
To enhance your analysis:
-
Select measurement points along the concerned watercourse (e.g., the Garonne).
-
Compare datas to observe flood wave propagation in terms of amplitude and duration.
-
Analyze water level variations between upstream and downstream points.
-
Apply a time offset to refine the analysis.

💡 Clicking on the legend lets you filter data to display only the relevant water height measurement.
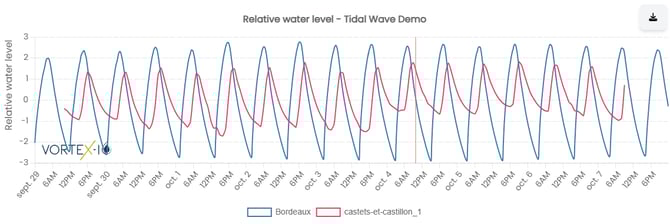
Tidal wave analysis
The "Comparisons" tab also enables the analysis of water level variations recorded by Micro-Stations located at different distances from the coastline.
When a tidal wave propagates, the station closest to the coast detects level variations first. However, a station placed further upstream will record the same phenomenon with a delay proportional to the distance from the ocean.
By comparing data from these stations, it is possible to evaluate the wave propagation time and the gradual attenuation of its amplitude. This analysis helps better understand the impact of tides on watercourses and anticipate their effects based on the location of measurement points.